
Real World, Real Science Curriculum Modules
Real World, Real Science is a NASA-funded collaboration with the Gulf of Maine Research Institute (GMRI) that builds on the success of GMRI’S existing LabVenture! Program to create new learning experiences focused on exploring the effects of climate change in and around the Gulf of Maine. As part of this project, ODI staff are developing curriculum modules that use authentic NASA and NOAA data to study the effects of the Earth’s changing climate on the animals and plants of Maine’s diverse habitats. Try the modules in your own classrooms! Six are currently available and one more is coming soon. Before you start to teach, read our Teaching Tips for helpful reminders.
Available Units:
- Global & Local Temperature: The Shape of Change
- Marine Ecosystem: Lobsters & Black Sea Bass
- Marine Ecosystem: Right Whales in Trouble
- Forest Ecosystem: Ticks & Lyme Disease
- Freshwater Ecosystem: Ice-Out
- Field Ecosystem: Wild Blueberries
The Shape of Change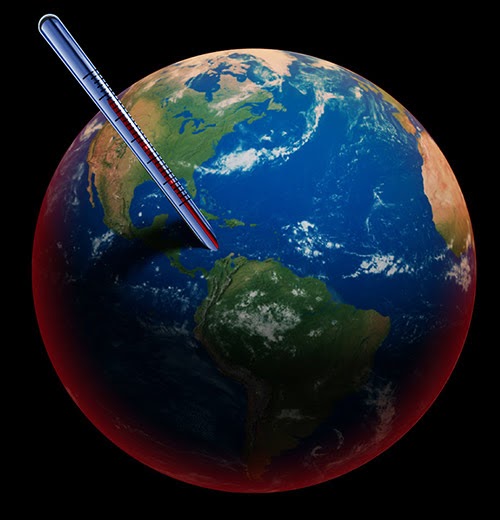
At LabVenture, students used data to explore how ocean temperature in the Gulf of Maine is changing and how those changes are impacting two key species that live there. In this set of lessons, students will explore global and local air temperature data and use a variety of data representations to determine the shape of change over time—past, present, and future.
Lessons
- Lesson 1: Global Change
Students use data to explore how global temperature is changing over time and practice good habits for interpreting data tables and graphs.
Teacher Guide | Online Student Lesson | Student Sheet (Google Doc or Print) - Lesson 2: Local Change
Students explore how temperature has changed in Maine, how it is predicted to change over the next 100 years, and how Maine's forecasted future temperature compares to other states.
Teacher Guide | Online Student Lesson | Student Sheet (Google Doc or Print)
Student Learning Outcomes
- Climate and Changing Ecosystems
- Changes in Maine’s ecosystems are local instances of global patterns of change.
- Data and Scientific Inquiry (This is the work that scientists do!)
- Data help us understand a problem or phenomenon and can be used as evidence to support scientific claims.
- Data can be represented and organized in different ways in order to answer different questions or reveal new information.
- Using data to understand a phenomenon involves being able to read and make sense of data representations (tables, graphs, maps, etc.) and models.
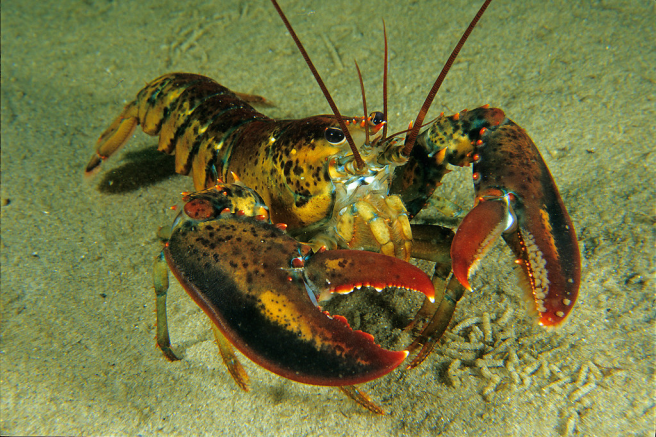 Marine Ecosystem: Lobsters & Black Sea Bass
As students learned in their visit to LabVenture, ocean temperatures in the Gulf of Maine are rising; and as this is happening, it is affecting the distribution of species in the Gulf - pushing lobster populations further north, and opening the Gulf to the presence of black sea bass, which were historically found further to the south. This series of lessons will continue to explore these changes, using data representations different from those used in LabVenture to explore how temperature is changing, and how catch rates of lobster and black sea bass are changing over time along the New England coastline. In each lesson, students will also be introduced to the concepts of modeling, and how scientists use models to predict what could happen to these species in the future.
Lessons
- Lesson 1: Changing Oceans
Students examine evidence that sea surface temperature is increasing along the New England coastline, learn about methods to study trends in data and make predictions using data, and run a simulation to illustrate the nature of the relationship between time and sea surface temperature.
Teacher Guide | Online Student Lesson | Student Sheet (Google Doc or Print) - Lesson 2: The Future of Lobster in Maine
Students examine changes in lobster catch rates around New England and explore a simple model of the relationship between lobster populations and ocean temperature.
Teacher Guide | Online Student Lesson | Student Sheet (Google Doc or Print) Lesson 3: The Future of Black Sea Bass in Maine Students examine changes in black sea bass catch rates around the coastline of the northeastern United States. Building off the previous two lessons students do more of the data manipulation as they look at trends and the relationship between black sea bass populations and ocean temperature.
Teacher Guide | Online Student Lesson | Student Sheet (Google Doc or Print)Lesson 4: Modeling the Gulf of Maine
Students begin to observe what happens when we add complexity to their models and students are invited to add their own inputs to the model, and to think about their effects.
Teacher Guide | Online Student Lesson | Student Sheet (Google Doc or Print)
Student Learning Outcomes
- Recognize graphs of change over time as evidence of change in ecosystems.
- Use information drawn from a combination of graphs and maps to describe changes with a geographical dimension (e.g. shifts in population distribution or range).
- Recognize that data can be organized and represented in different ways to answer different questions, e.g., students make connections between a data table and a data visualization.
- View local instances of change as part of a larger system of change.
- Use data as evidence to support a claim.
- Use data visualizations to communicate about and to understand/make sense of a phenomenon.
- Recognize models as a tool that can help you think about the future.
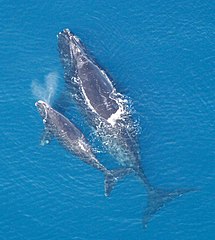 Marine Ecosystem: Right Whales in Trouble
Students learn the story of the mysterious deaths of more than a dozen right whales near Maine and Nova Scotia in 2017. What might be causing these critically endangered whales to move into the busy shipping lanes and fishing grounds of the Gulf of St. Lawrence? Students gather information and analyze data to uncover a surprising relationship between these huge whales, climate, and one of Earth’s tiny creatures – plankton called copepods.
Lessons:
- Lesson 1: What’s Happening?
In this lesson, students are introduced to the mystery of the dead right whales by reading a news article adapted from one published in Science magazine in 2017, a year in which an unusual number of the critically-endangered whales died in the ocean near Maine and Nova Scotia. They will also study data about right whale sightings in the Gulf of Maine, the Bay of Fundy and the Gulf of St. Lawrence during three different time periods, and investigate what is changing. They discuss their initial ideas about why more right whales are showing up in the Gulf of St. Lawrence in recent years.
Teacher Guide | Online Student Lesson | Student Sheet (Google Doc or Print) - Lesson 2: What do Right Whales Need to Survive and Thrive?
In this activity, students study a map that shows the North Atlantic right whale’s journey over the course of a year. They identify important areas where the whales spend their time, and what they are doing there. They also learn about the right whales’ dependency on a critical food source, plankton called copepods. They compare these tiny crustaceans to rice grains, and calculate how much whales need to eat in a day when they are feeding in the North Atlantic.
Teacher Guide | Online Student Lesson | Student Sheet (Google Doc or Print) - Lesson 3: Copepods - A Critical Food Source
In this activity, students watch a slide presentation about copepods, their important role in the food web of the North Atlantic, their life cycle, and their fascinating annual hibernation. They take structured notes about important information using drawings and words. Students then analyze data about what has been happening to copepod populations and right whale sightings at a critical feeding location and time near Maine and Nova Scotia. They think about what they can learn from the data about why right whales might be shifting to the Gulf of St. Lawrence.
Teacher Guide | Online Student Lesson | Student Sheet (Google Doc or Print) - Lesson 4: Is it the Environment?
In this activity, students analyze a graph and map of ocean temperature data for the right whales’ feeding grounds near Maine and Nova Scotia. They investigate how the temperatures have been changing over time where whales typically feed on copepods, and look for regional patterns in sea surface temperature across the Gulf of Maine, the Bay of Fundy and the Gulf of St. Lawrence. They also do a short reading and study a map of ocean currents in the North Atlantic near Maine and Nova Scotia, and think about how shifting ocean currents could impact both the temperature of water in the Gulf of Maine, and the copepods.
Teacher Guide | Online Student Lesson - Lesson 5: Making a Recommendation
In this activity, students review the data and information they studied in this module and develop evidence-based ideas about what is causing the whales to shift their location into harm’s way. They then create a poster that describes what is happening and recommends measures that should be taken to protect the whales, taking into consideration potential economic impacts to the fishing and shipping industries.
Teacher Guide | Online Student Lesson | Student Sheet (Google Doc or Print)
Student Learning Outcomes
- Climate is changing in the Gulf of Maine and globally
- Ecosystems and individual species are impacted by climate change
- Change over time and its impacts can be studied and understood by making observations and collecting, analyzing, and interpreting data
- Understanding climate change and its impacts is a collaborative effort involving professional scientists and members of the community
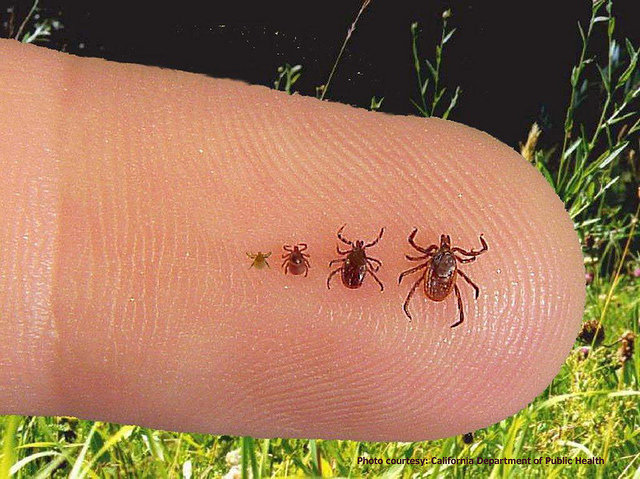 Forest Ecosystem: Ticks & Lyme Disease
Lyme disease, the most common tick-borne illness in the U.S., is on the rise in Maine. Scientists believe that temperature and humidity play an important role in the survival of ticks and the spread of Lyme disease. At LabVenture, students used data to explore how ocean temperature in the Gulf of Maine is changing and how those changes are impacting where lobsters and black sea bass prefer to live. In this set of lessons, students will use data to explore how the rate of Lyme disease is changing across the state of Maine as well as how temperature and rainfall are changing in two different Maine counties. Students will use a variety of data representations to make evidence-supported claims about and what those changes might mean for the survival of ticks and the spread of Lyme disease in the future. Students will synthesize what they learn by writing a public service announcement to inform the public about Lyme disease and to persuade them to take action.
Lessons
- Lesson 1: Lyme Disease in Maine
Students use multiple data representations to ask and answer questions about what's happening with the spread of Lyme disease, and share their personal connections to the disease and interaction with ticks.
Teacher Guide | Online Student Lesson | Student Sheet (Google Doc or Print) - Lesson 2: Lyme Disease by County
Students investigate how the rate of Lyme disease is changing in their county, and other counties in Maine, over time.
Teacher Guide | Online Student Lesson | Student Sheet (Google Doc or Print) - Lesson 3: Temperature
Students learn about the ideal temperature range for ticks and use data to explore how temperature is changing across Maine. Students will compare temperature data, identify trends, and forecast future temperature conditions for two counties to determine if these counties provide suitable conditions for ticks.
Teacher Guide | Online Student Lesson | Student Sheet (Google Doc or Print) - Lesson 4: Rainfall
Students explore how precipitation (rainfall) is changing over time in Maine and what impacts those changes might have on the spread of Lyme disease.
Teacher Guide | Online Student Lesson | Student Sheet (Google Doc or Print) - Lesson 5: Write a Public Service Announcement
Students consolidate the evidence they have gathered about the transmission of Lyme disease, its increasing prevalence in Maine, and the climate factors driving that trend to write a community-oriented public service announcement in a creative format.
Teacher Guide | PSA Graphic Organizer | Images and Data Visualizations | Sample PSA Grading Rubric
Student Learning Outcomes
- Climate and Changing Ecosystems
- Changes in Maine’s ecosystems are local instances of global patterns of change.
- Changes in ecosystems have impacts on the species within those ecosystems—some populations thrive, some move, some decline.
- Data and Scientific Inquiry (This is the work that scientists do!)
- Data help us understand a problem or phenomenon and can be used as evidence to support scientific claims.
- We use data in a combination of graphs and maps to represent ecosystem change in both time and space.
- Data can be represented and organized in different ways in order to answer different questions or reveal new information.
- Using data to understand a phenomenon involves being able to read and make sense of data representations (tables, graphs, maps, etc.) and models.
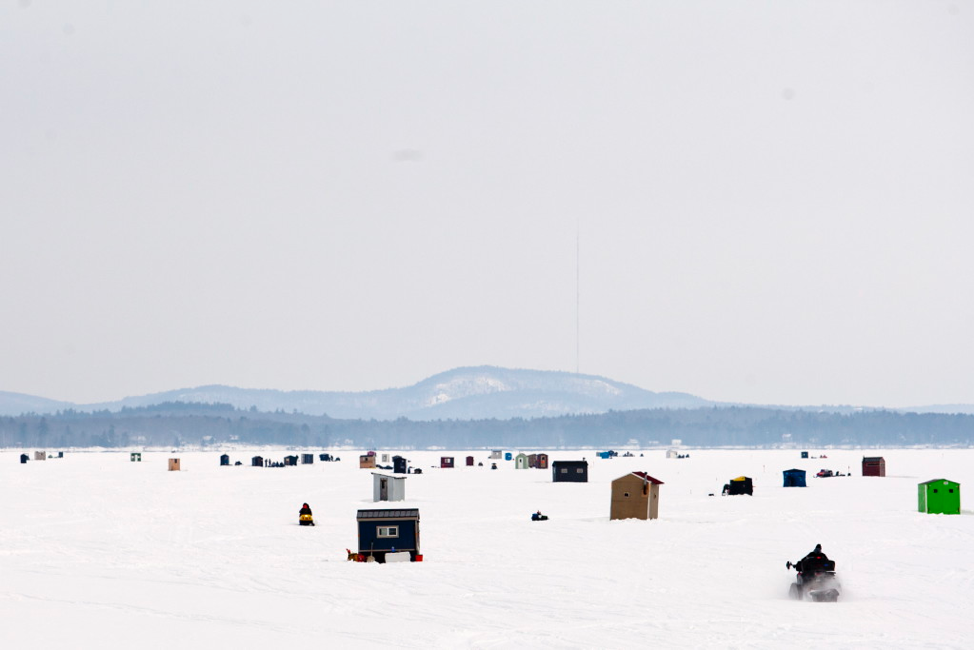 Freshwater Ecosystem: Ice-Out
People have been recording lake ice-out day (the day of the year in which ice cover leaves a lake) in Maine for more than two hundred years out of both general curiosity and community interest. In this learning module, students explore how average winter temperatures and the ice-out day for Sebago Lake are changing over time.
Lessons
- Lesson 1: On Thin Ice
Students begin their exploration of lake ice-out in Maine, focusing on the specific example of multiple cancellations of the Sebago Lake Rotary Fishing Derby due to unsafe ice conditions. Students share their personal connections to winter lake ice and learn some basics about ice safety.
Teacher Guide | Online Student Lesson - Lesson 2: Temperature
Are changing temperatures on land in Maine impacting when lake ice is melting? In this lesson, students use data to explore how winter temperature is changing near Sebago Lake by considering “what’s normal,” identifying trends, and forecasting future winter temperatures.
Teacher Guide | Online Student Lesson | Student Sheet (Google Doc) - Lesson 3: Ice-Out Day
Students consolidate the evidence they have gathered about the Sebago Lake Rotary Ice Fishing Derby, historical and forecasted trends in lake ice-out date, and the climate factors driving that trend to write a recommendation letter to the Derby’s organizing committee in an engaging format.
Teacher Guide | Online Student Lesson | Student Sheet (Google Doc) - Lesson 4: Write a Recommendation Letter
Students begin to observe what happens when we add complexity to their models and students are invited to add their own inputs to the model, and to think about their effects.
Teacher Guide | Graphic Organizer | Images and Data Visualizations | Letter Grading Rubric
Student Learning Outcomes
- Climate and Changing Ecosystems
- Changes in Maine’s ecosystems are local instances of global patterns of change.
- Changes in ecosystems have impacts on the species within those ecosystems—some populations thrive, some move, some decline.
- Data and Scientific Inquiry (This is the work that scientists do!)
- Data help us understand a problem or phenomenon and can be used as evidence to support scientific claims.
- We use data in a combination of graphs and maps to represent ecosystem change in both time and space.
- Data can be represented and organized in different ways in order to answer different questions or reveal new information.
- Using data to understand a phenomenon involves being able to read and make sense of data representations (tables, graphs, maps, etc.) and models.
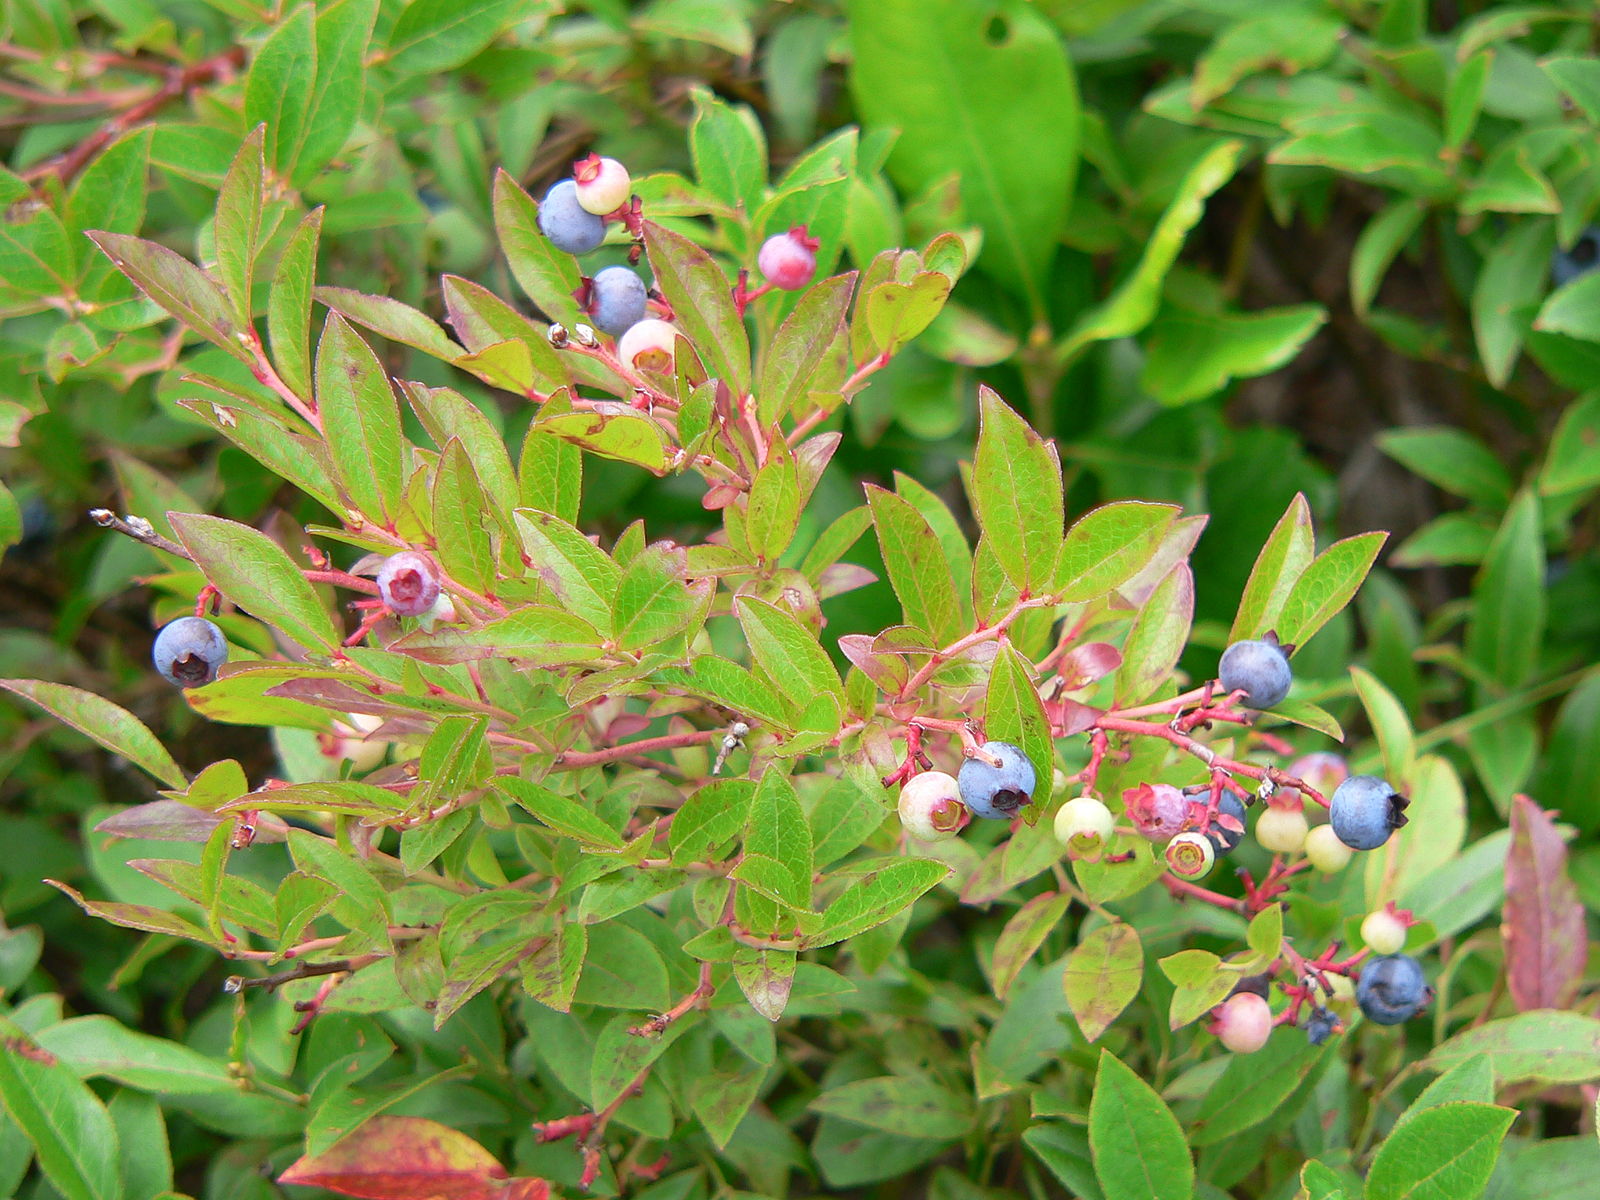 Field Ecosystem: Wild Blueberries
Maine is the largest wild blueberry producer in the world. These small berries are well suited to a cool climate and have been growing across Maine, Atlantic Canada, and Quebec for centuries. However, a changing climate and unpredictable weather conditions have posed challenges to recent harvests. In this module, students learn about the important role bees and pollination play in growing wild blueberries and use data to explore how spring temperature and rainfall, growing season length, summer drought, and extreme heat may be impacting bees and wild blueberry production.
Lessons
- Lesson 1: What’s So Wild About Blueberries?
Students begin this module by learning some basics about wild blueberries and their preferred growing conditions. They explore production data for Maine and are introduced to ways in which a changing climate may pose a threat to this iconic crop.
Teacher Guide | Online Student Lesson | Student Sheet (Google Doc or Print) - Lesson 2: Spring
Students learn about the importance of bees and pollination in the process of growing wild blueberries. They explore spring temperature, rainfall, and growing season length data and consider how these factors may have affected pollination and production of wild blueberries in recent years.
Teacher Guide | Online Student Lesson | Student Sheet (Google Doc or Print) - Lesson 3: Summer
Wild blueberries, like all other crops, require a certain amount of water for healthy growth. Summer drought and extreme heat can be particularly damaging to the quality of berries at harvest time. Students explore how these factors may have affected recent wild blueberry production and what future projections might mean for wild blueberries and bumble bees.
Teacher Guide | Online Student Lesson | Student Sheet (Google Doc or Print) - Lesson 4: Design & Propose a Native Pollinator Garden
Bees are essential for growing food. With climate change causing more unpredictable weather, bees need our help. More bee habitat means more bees, and more bees means more pollination—and more wild blueberries. A great way to help bees is to plant a pollinator-friendly garden that provides them with food, water, and shelter. In this culminating lesson, students are tasked with developing a proposal to design and build a native pollinator garden. They will need to use data from the Wild Blueberries module as evidence for how their garden will help support wild blueberry production in Maine.
Teacher Guide | Student Sheet (Google Doc or Print) | Images and Data Visualizations | Sample Grading Rubric
Student Learning Outcomes
- Climate and Changing Ecosystems
- Changes in Maine’s ecosystems are local instances of global patterns of change.
- Changes in ecosystems have impacts on the species within those ecosystems—some populations thrive, some move, some decline.
- Data and Scientific Inquiry (This is the work that scientists do!)
- Data help us understand a problem or phenomenon and can be used as evidence to support scientific claims.
- We use data in a combination of graphs and maps to represent ecosystem change in both time and space.
- Data can be represented and organized in different ways in order to answer different questions or reveal new information.
- Using data to understand a phenomenon involves being able to read and make sense of data representations (tables, graphs, maps, etc.) and models.
NASA